Public Transport Made Equal

We believe that with providing public transport comes responsibility for the public. Changes in the network, wanted or not, can result in a severe impact on both access equality and profitability. 
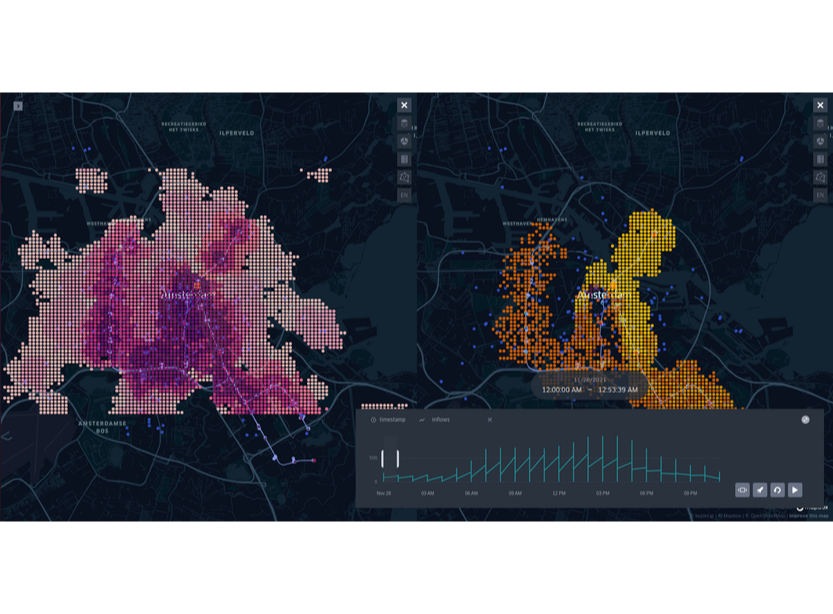
EquiCity provides your operations with a single solution to assess how opportunity access-equality changes with your public transport network availability. In addition, EquiCity approximates the impact of topology modifications on the usage of the network, allowing for more informed decision-making based on both social equality and profit.

Measure

We help you to quantify social equity in your network - from Cumulative Opportunity Measure to per-group inequality measures. We cover anything from Gini to Theil indices and beyond. A core component for this quantification comes through our usage of Conveyal's R5.

Predict

Our Graph Neural Network powered prediction engine allows for clear insight into the impact of topology changes within a transportation network. It shows the redistribution of travelers and the resulting crowdedness at stations in the network.

Design

We support your network expansion/reduction decisions with automatic infrastructure designs tailored to your needs, while always maximizing access equality.

Present

Everything you measure, predict, or design in EquiCity can be presented to the public with one simple click. This makes community engagement, fundamental to equal access, a breeze.

Our supporters

This project is backed by an E-Infra grant offered by the NWO and research is continued.

Our Origins

The work presented here has been realized during the data systems project course 2021/22, provided by the University of Amsterdam and tailored to the Master of Science Information Science: Data Science track.

Discover More About the Program

Our Assumptions and Limitations

As with every approximation to reality, we want to clearly mention what the limitations of our solution are:

  • Metro network only - no other modes of transport
  • Walking ingress and egress mode
  • 30 minute travel time cut-off
  • No assumptions made on user's willingness to adapt to the new scenario
  • Interpolation of missing data on metro-network check-ins

Our Case Studies

Focused on the city of Amsterdam, we quantified the impact of three scenarios. We chose to specifically focus on the impact on the metro network as the data for that part of the GVB network allowed us to achieve the best results.

No more Noord - Social Segregation

In this use-case we replicated some failures of the metro network which Amsterdam's population has already experienced. With Noord being completely segregated from the rest of Amsterdam, we explore the impact on university staff and students to reach their institutions.

A significant loss - Missing Connectivity

With Centraal Station off the grid from any metro station, we identify the neighbourhoods most affected in their ability to reach hospitals.

Culture shock - Impact on Tourism

Here we asked ourselves what the impact on tourism would be if the metro 52 stations Rokin and Vijzelgracht would be closed. Observe closely how our Graph Neural Network is able to infer the re-distribution of check-ins in the neighbouring stations.